You’ve almost certainly heard people who say that their job is mostly “putting out fires all day.” Unless you’re a firefighter (the kind that puts out literal fires), a police officer, or an Emergency Room Physician, it’s not optimal to always be focusing on the “tyranny of the urgent.” But knowing it’s becoming the way many EM functions operate, I wondered what a long look backwards might tell us about an institution’s enrollment strategy. So, of course, I looked at the data.
It can be revealing, to say the least. Strategy is long-term, tactics are short-term; but you need to two to work together in order to have a chance to get the results you hope for (and even then, there are no guarantees in our business, which is why I often think Reinhold Niebuhr should be the patron saint of EM.)
I took a look at several private institutions that have several things in common. And I made an assumption: That there is always some percentage of variance even in the most well-run operation, and allowing for that, I set a threshold of plus for minus 5% change in year-over-year headcount change in the first-year class. This is the reality most institutions face, save the few highly rejectives who can always manage to fill their class precisely using wait lists and excessive demand.
It’s impossible to tell what the goals of the institution were, of course, but other than the often-heard strategy of “more,” I think it’s safe to assume that stability and predictability are desirable.
Here is the total group of institutions (2024 and 2025 data were manually added to the data set and are thus not IPEDS-official). You can see a lot of variation up and down among some of the institutions. The gray box binds the plus-or-minus 5% change.
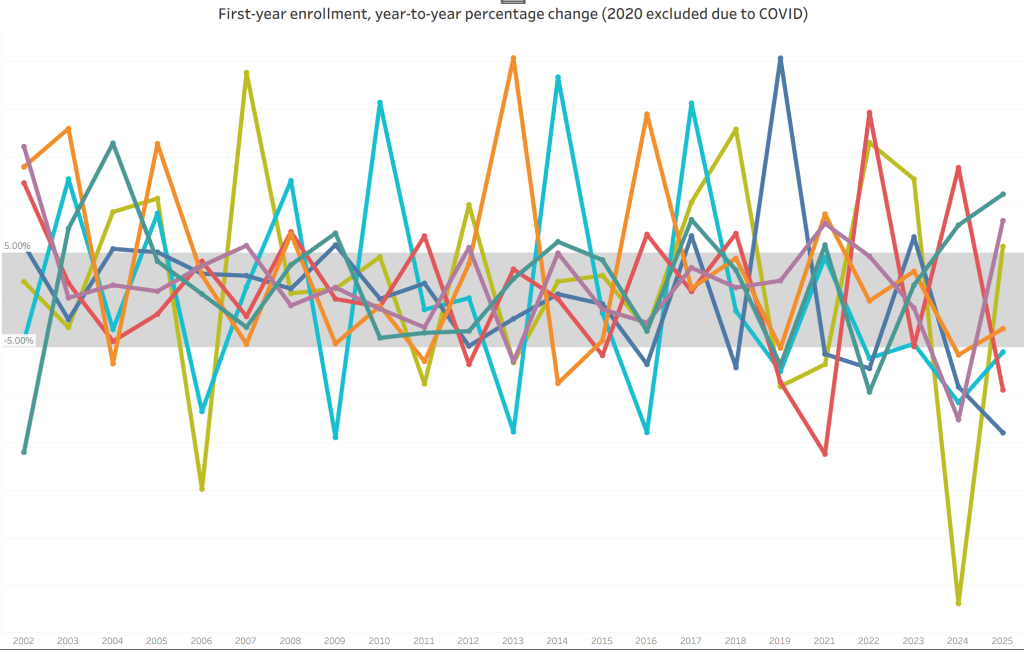
Now, here are the seven institutions, with apologies to Quentin Tarantino.
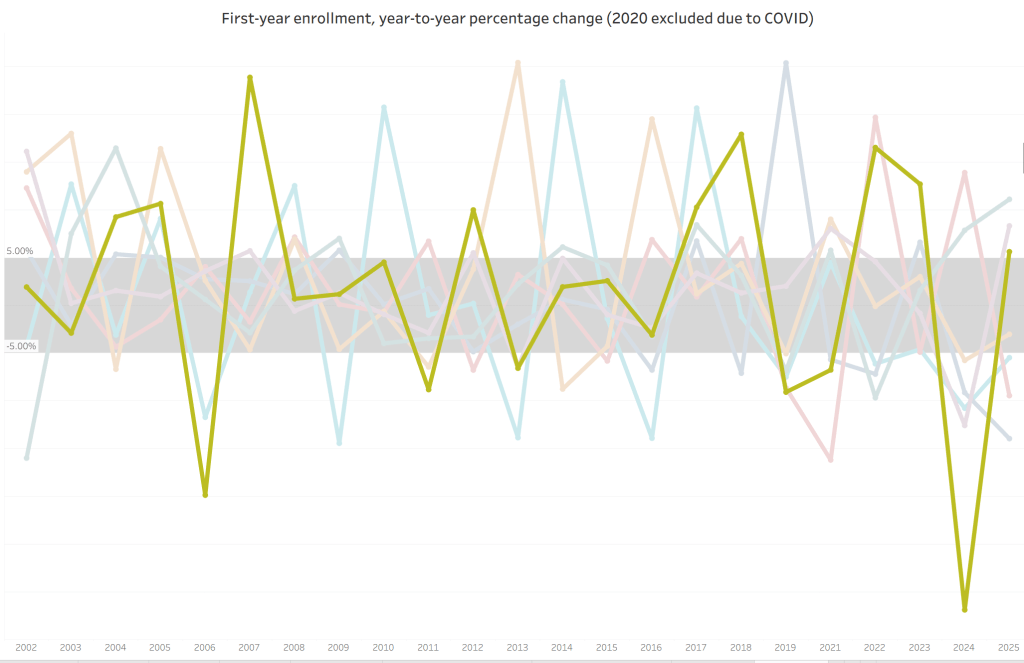
Mr. Gold:
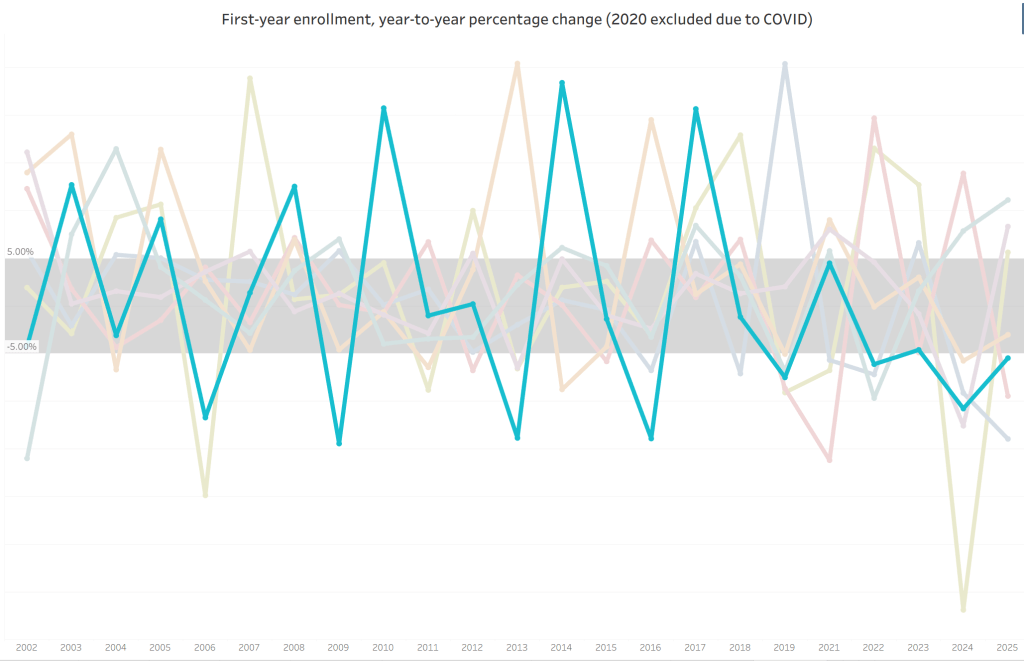
Mr. Aqua:
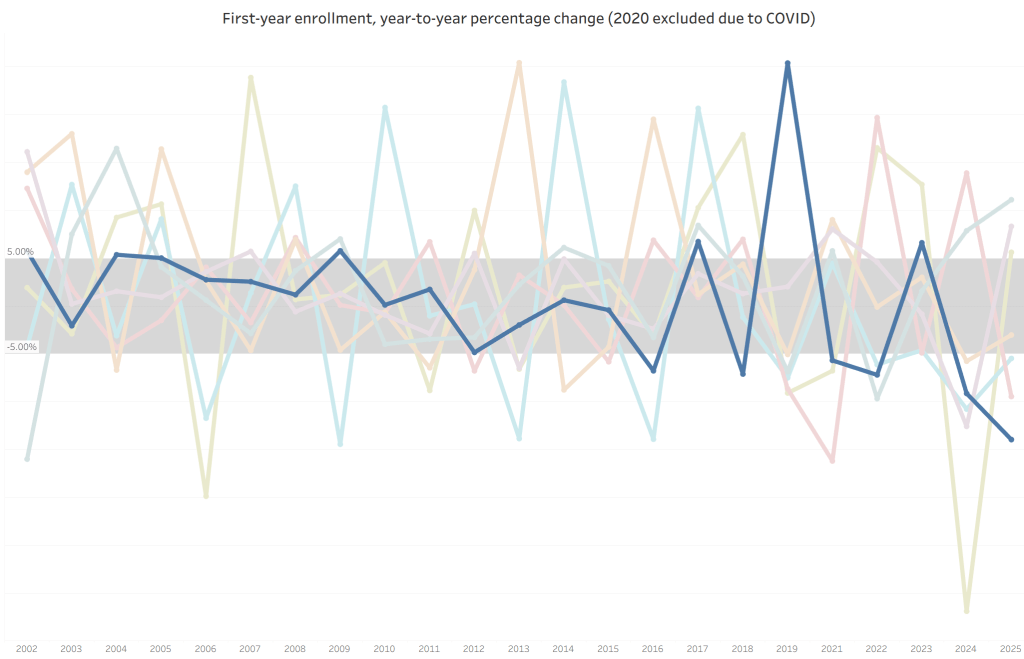
Mr. Blue:
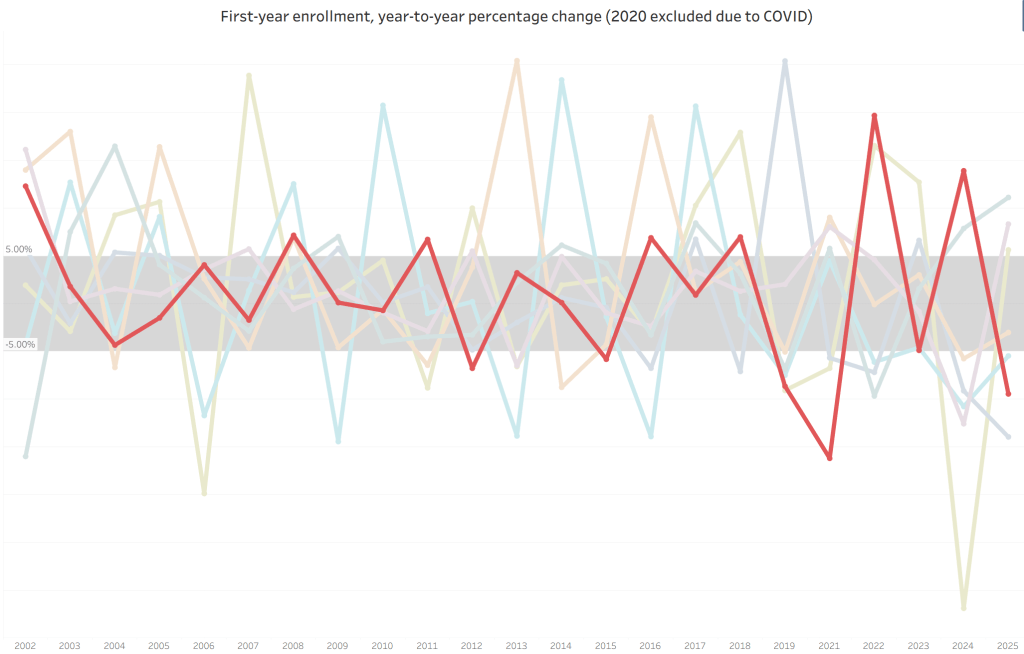
Mr. Red:
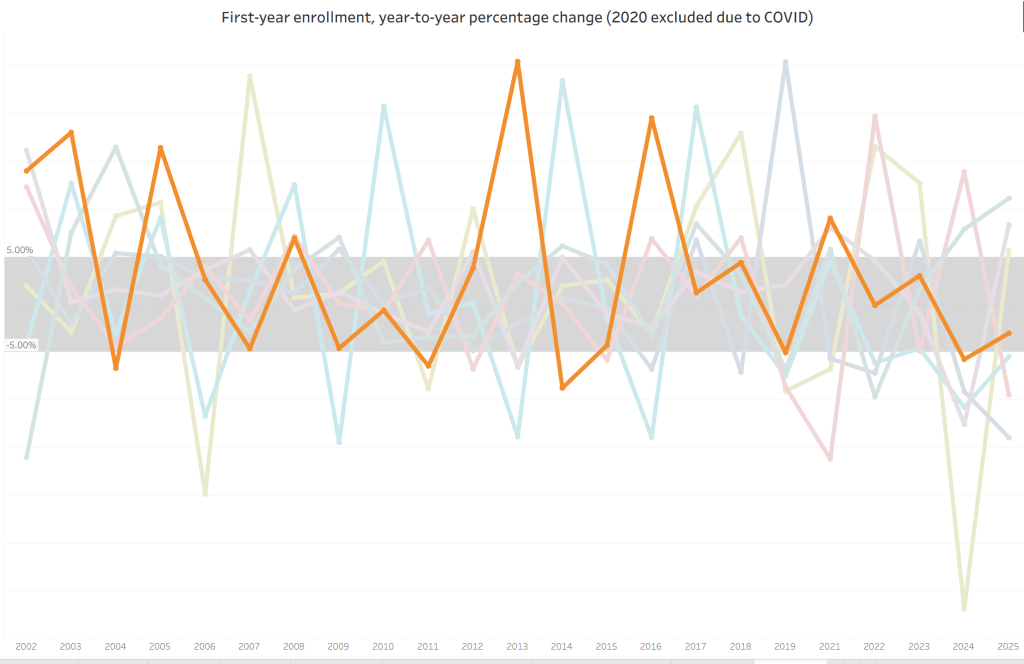
Mr. Orange:
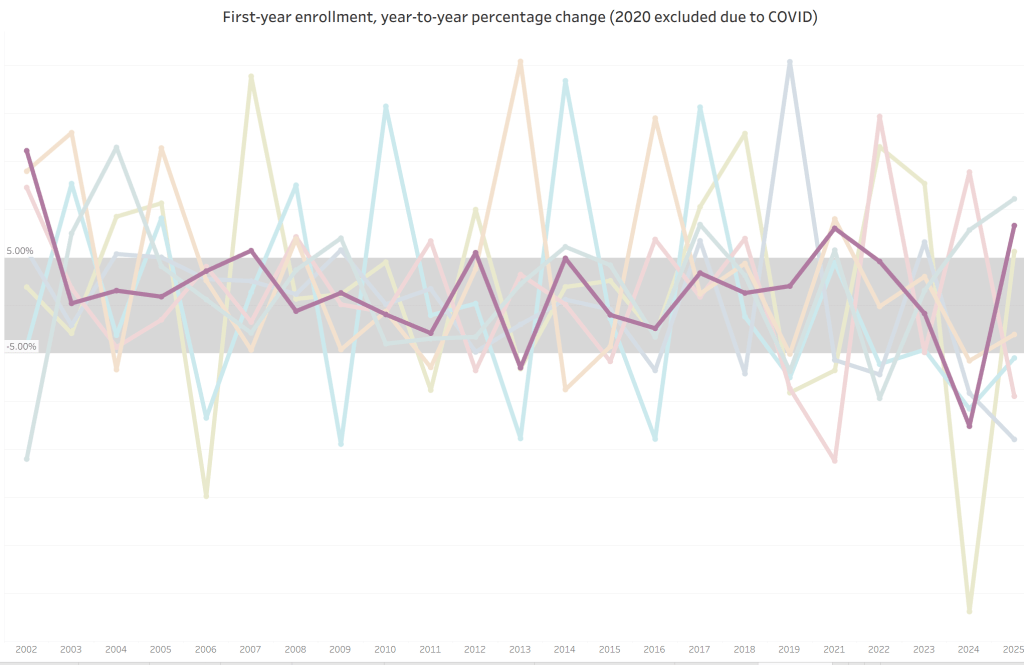
Mr. Purple:
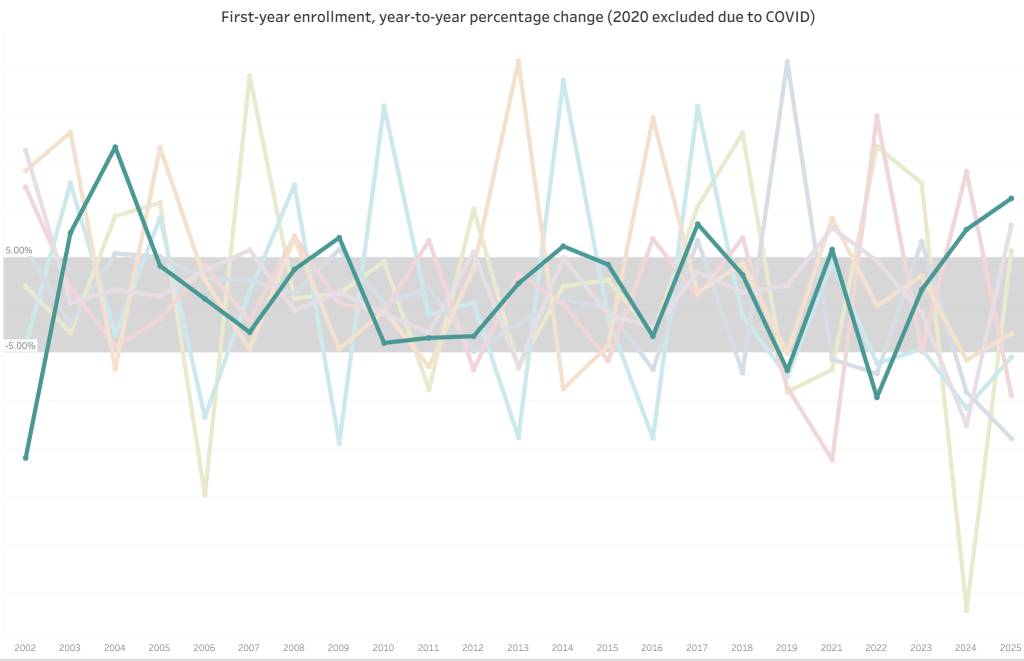
And, last but not least, Mr. Teal:
You should be able to see some patterns here: Some institutions have reasonable, long-term results that look mostly consistent over time. Others are, for lack of a better word, all over the place. None of these institutions is highly selective, all of them are tuition driven, and all of them are at the mercy of the market.
That last point, especially, is compelling. Some institutions have had long stretches of stability, followed by more recent volatility. Some have always seemed to live year-to-year. Some may have never had to have any specific strategy, believing–to a greater or lesser extent–that enrollment is something that happens to you.
If we looked at your institution’s results, and added some softer data points like goals, institutional drivers, discount rates, etc., what might we see? More important, would those results suggest you’re in charge, or just riding the waves? And what actions would you take once you thought you had the answer?
As always, a little bit of data is the best place to start.
Discover more from Enrollment VP
Subscribe to get the latest posts sent to your email.
