I’ve written before about what it means to be “data driven” in Enrollment Management. Since I posted this about ten months ago, people have asked me to clarify: If knowing stats is not data driven, what does it mean? To me it means seeking, finding, and learning from the patterns and trends you see in the data, and understanding the limits of how you can effect change in those patterns.
The just-released 2024 IPEDS enrollment data offers a good lesson to us, I think.
So here’s you, an enrollment manager in Florida, answering a question from your trustee (who lives in Denver, by the way), about why you don’t recruit in, or enroll many students from, the state of Colorado. You could offer some off-the-cuff observations about weather, the lack of mountains or skiing, politics, or distance, all of which might be both entirely appropriate and entirely ineffective in placating this trustee. Or, you could show them and help them understand. So let’s all walk through this together.
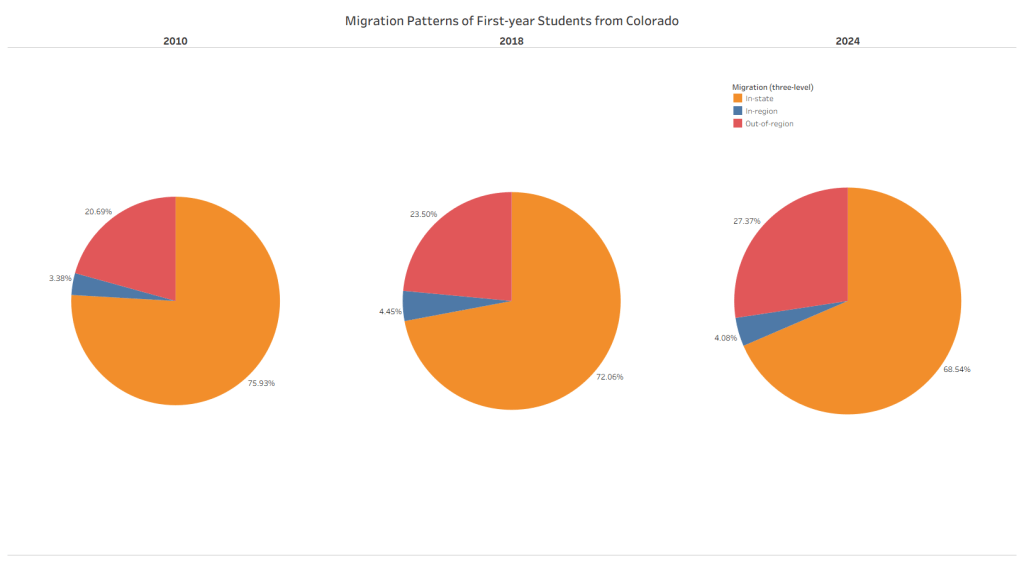
If you look at Colorado students, you’ll find they almost always go to college in Colorado, although that percentage is dropping a bit (on both measures, this mirrors national trends; although more students are traveling farther away, the vast majority still enroll in-state). Another 4% stay in the region. Only about one out of four venture to a different region in the US. (Click on images to expand).
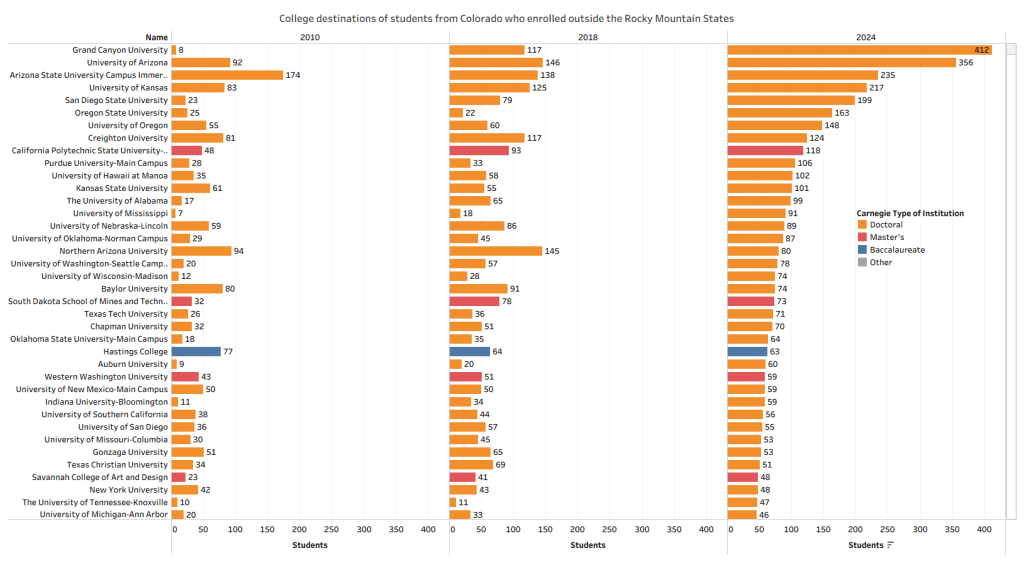
You could take a look at the destinations of students who left the region, and how those destinations have changed over time, but you have to scroll down a long way to see any institution near you.
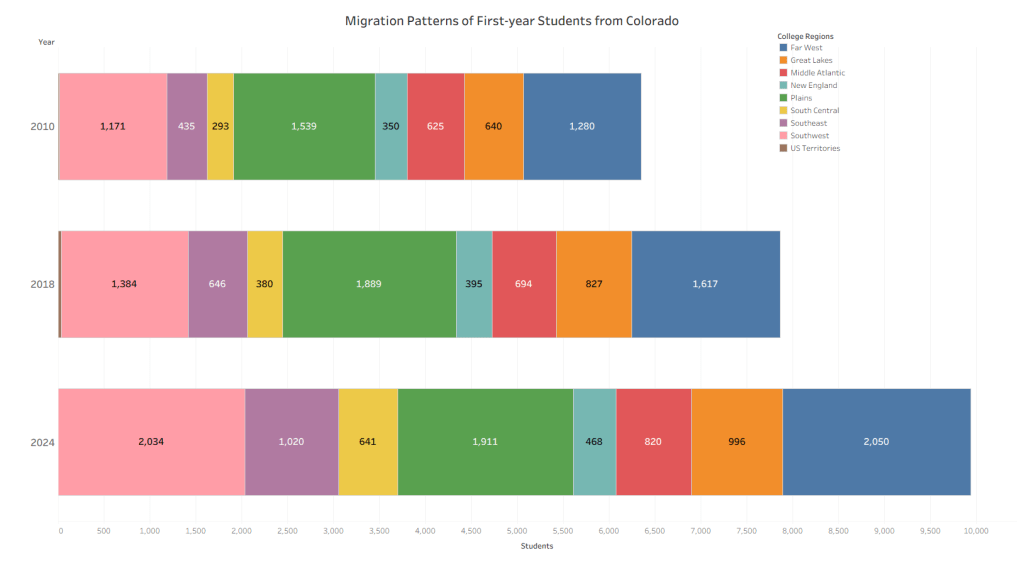
That might be enough for you, but is it enough for your trustee? Maybe, but it’s easy to drill even deeper. Of those who do leave the region (and we’re down to about 10,000 students in 2024), only about 1,000 head for the southeast, shown here in purple.
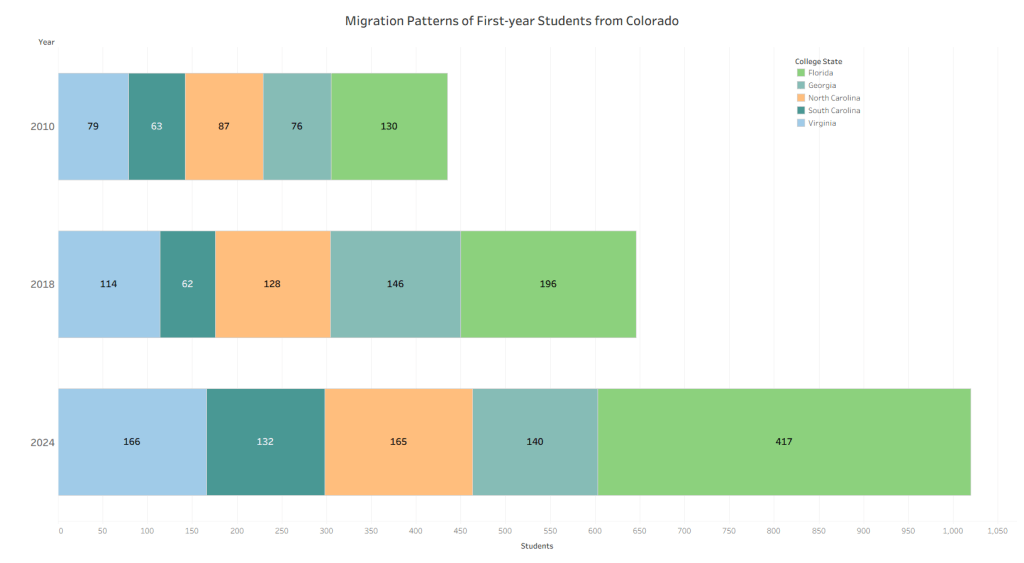
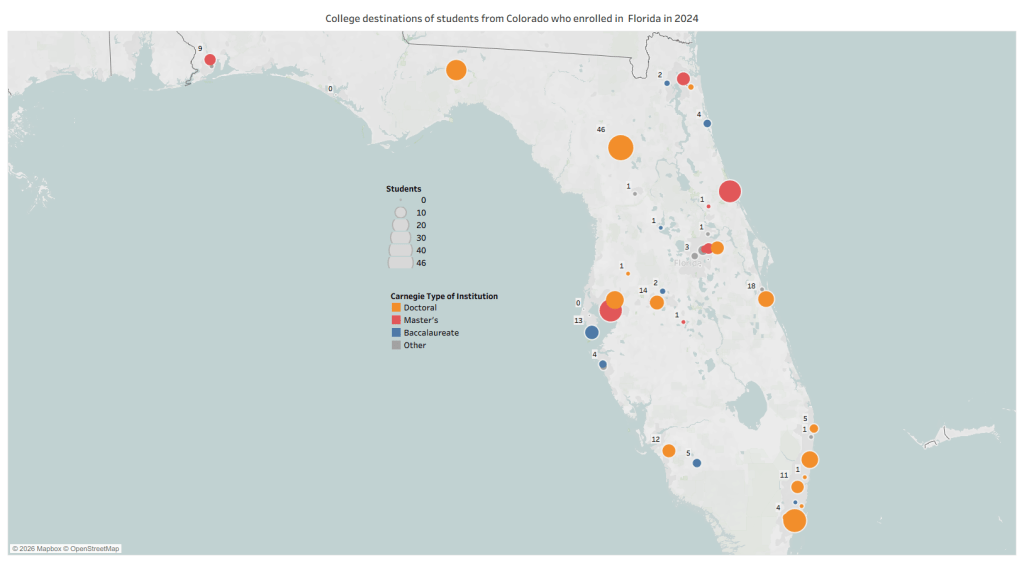
Of those who head to the Southeast, only about 40%, or 417, enroll in Florida.
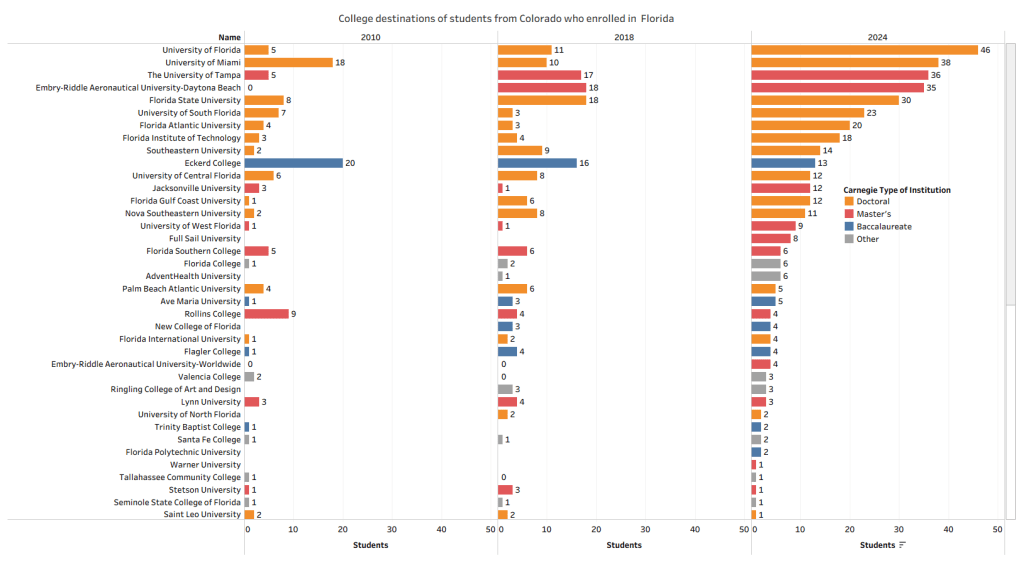
Now, dive deeper and take a look at all those students who leave Colorado, enroll at a college in Florida, and see what types of institutions they enrolled in. Scroll back up to the second chart for a second, and note that the most successful out-of-region institution in recruiting Coloradoans was Grand Canyon University, a college with a specific niche and character. By the way, I’m not sure if that enormous increase is due to them offering distance programs, discounting heavily in the state, recruiting harder than anyone has ever recruited, bad data reporting, or some combination of those factors. For this demonstration, it doesn’t really matter.
Now it’s up to you: Does looking at this help you see an opportunity? Or maybe a potential waste of time and effort? It might depend on whether you’re public or private, whether you’re large or small, or, even, where you’re located.
But even with a great data set, you can only get so far with numbers. At some point, your intuition and your context need to take over. Using everything at your disposal (like checking websites to see if any of these institutions actively recruit in Colorado), you can think about costs and tradeoffs of putting your college on the radar of prospective students in the state.
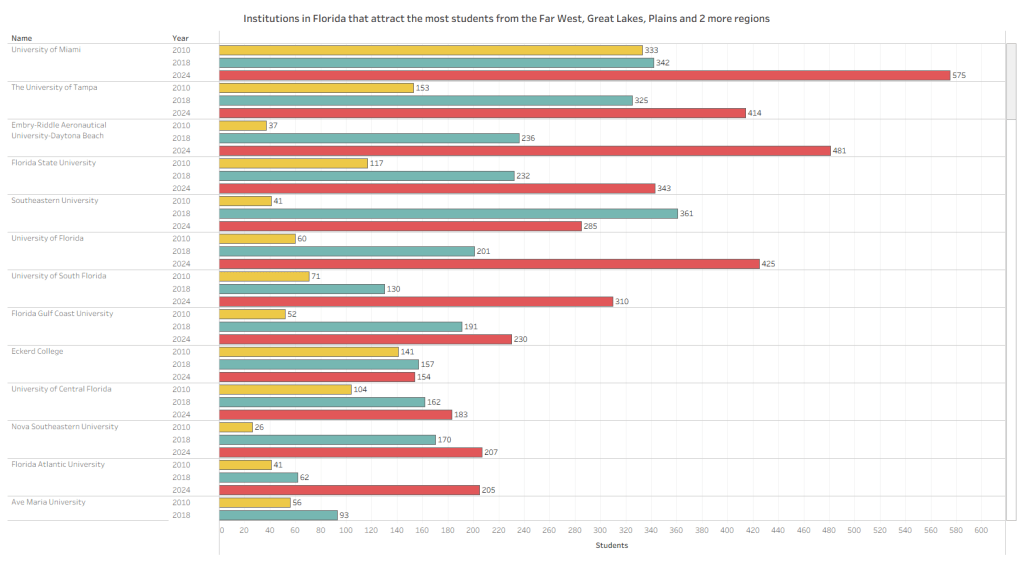
However, with this great data set, you can do something else: You can look at it backwards. That is, look at the institutions in your state who enroll larger numbers of students from outside the region, and understand whether they’re doing something right, or you’re doing something wrong. Maybe your trustee would like to see this, and maybe this will help focus the conversation.
Does this intrigue you? Confound you? Scare you? Maybe I can help. With a couple of clicks, you can schedule time to talk about this or other data or enrollment challenges you might have. And the discussion is free.
Discover more from Enrollment VP
Subscribe to get the latest posts sent to your email.
