My last post asked you if you know why your competition is changing, if you are at a private college. One of the things I’ve noticed in visualizing IPEDS and Clearinghouse data is the increased competition private colleges are facing from public institutions, often (but not always) in their own state.
So I looked at trends in two states, using similar liberal arts colleges. The first is in the south in a state with both a flagship and a land grant institution; the second is in the Midwest in a state where the flagship and land grant are the same institution. And the third is in another southern state with both a flagship and a land grant. The public institutions are in orange, and the private institution is in blue.
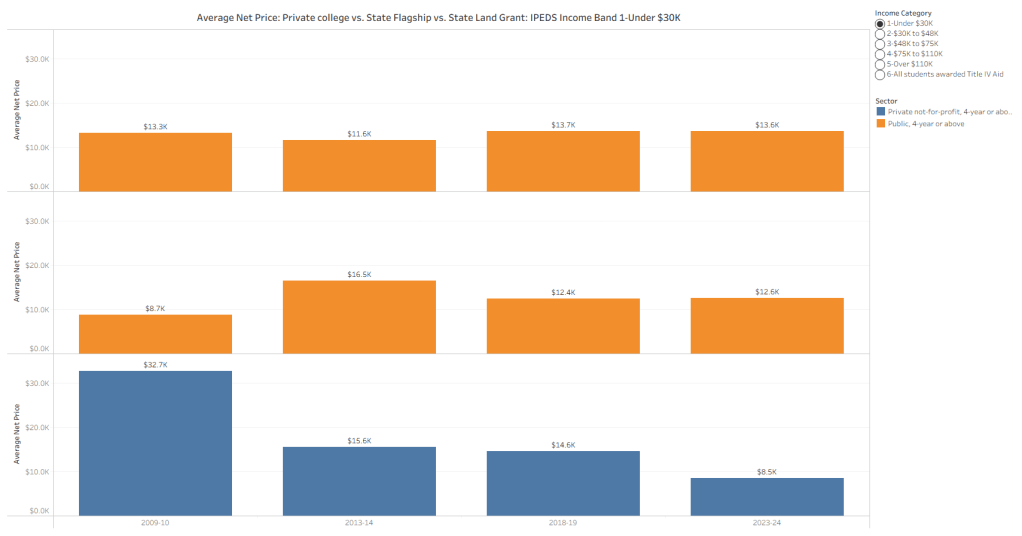
For this example, I looked at student’s net price for families from incomes under $30K. The results are surprising, both in the shape and the size of the discrepancies, and the patterns over time.
Net price, of course, is not the sole determinant of a student’s choice of college. But these patterns reveal a lot about institutional awareness, ability to respond, and how mission might affect policies.
If your trustees are wondering about why you’re losing market share, data like this might be a sobering reality check for them.
(note: If you want to view the images larger, right click on the image and open in a new tab.)
Southern State 1:
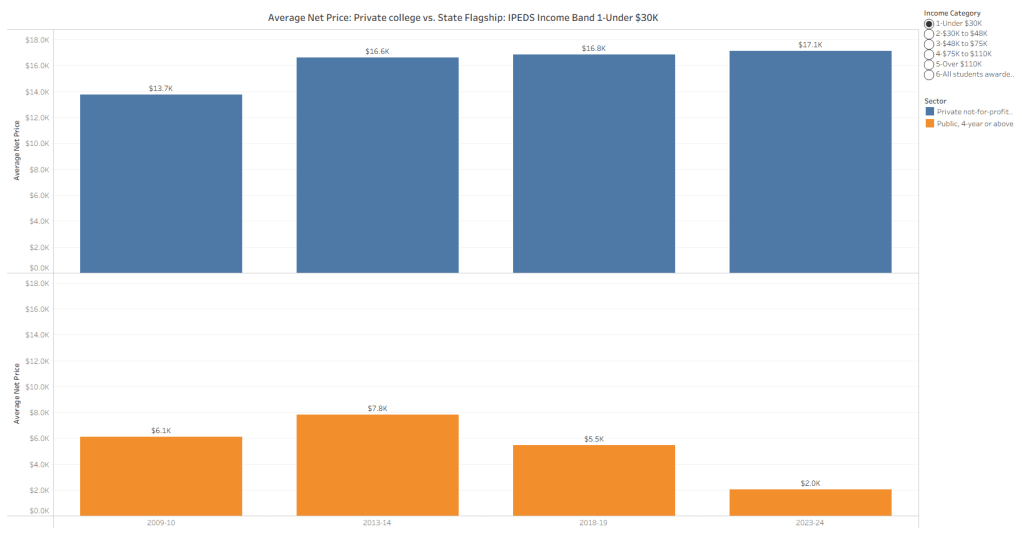
The Midwestern State:
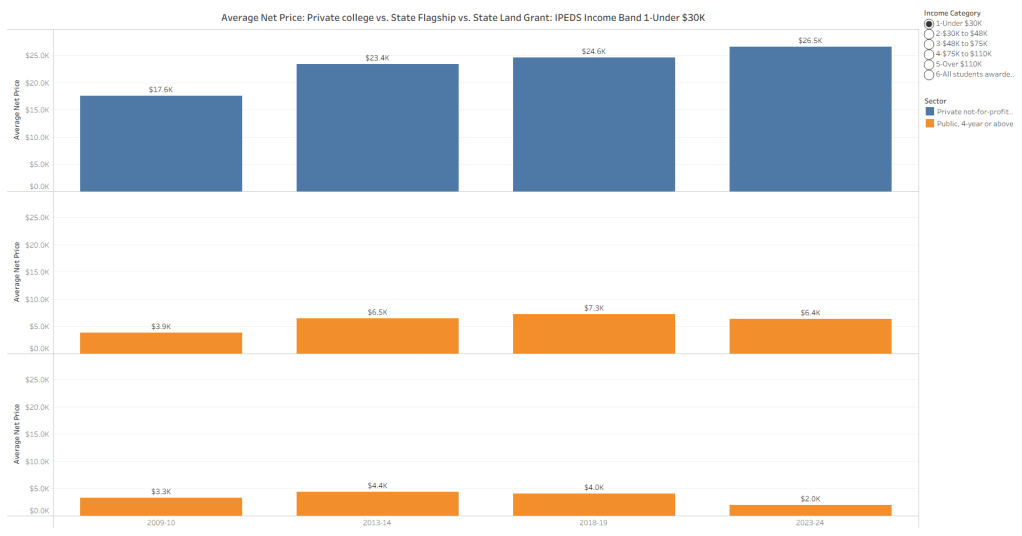
And the second Southern State:
Discover more from Enrollment VP
Subscribe to get the latest posts sent to your email.
